Data analysis through chat
Ask questions about connected data in everyday language, then ask for more detail while Julius retains the previous analysis context within the conversation.
Julius: Chat with your data cleverkitools.comcurated by Clever Mangos
 Editorial selection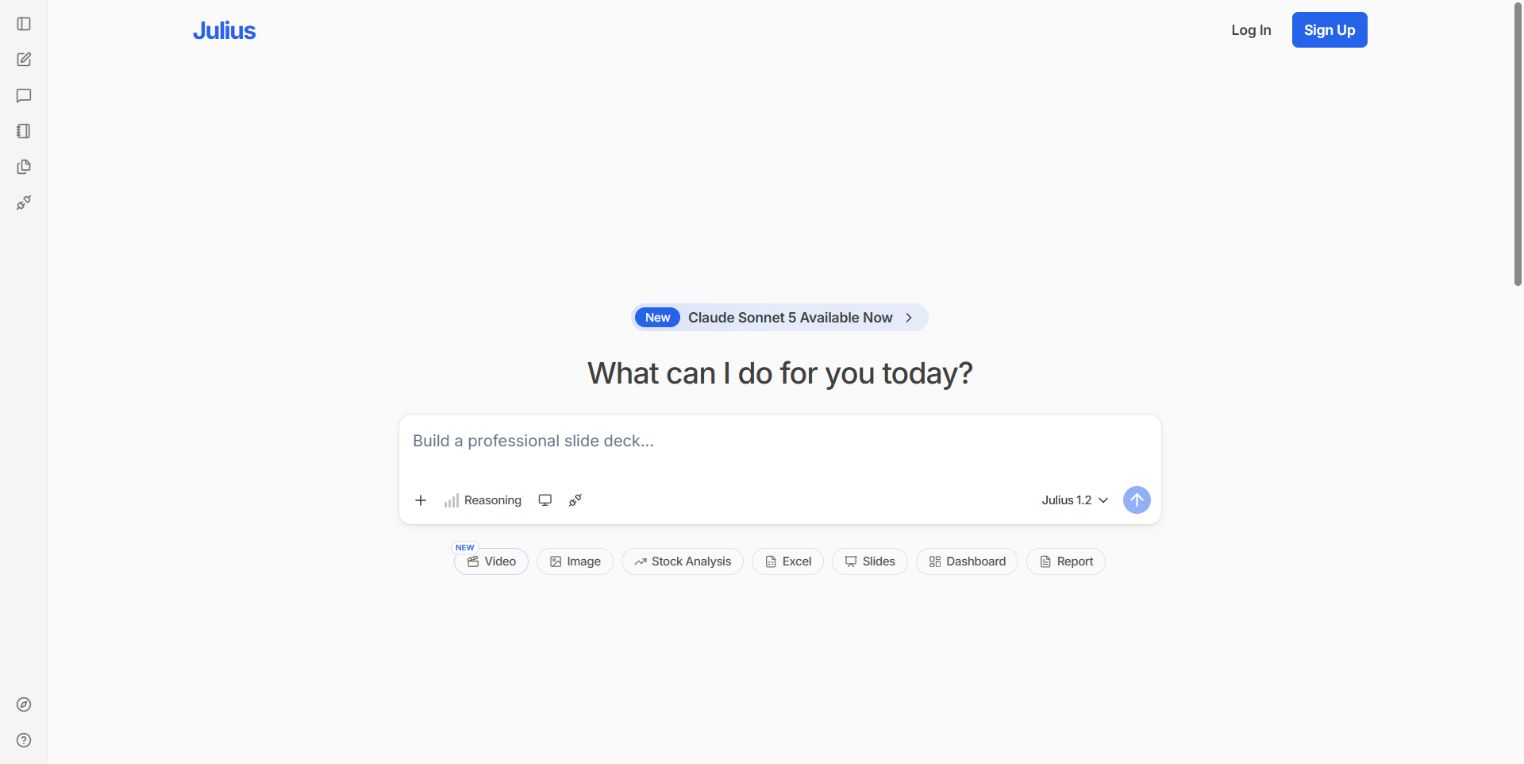
Julius: Data analysis through chat, including spreadsheet interpretation, charts and Python-powered analysis. In practice, its value centers on chat-based data analysis, charts from spreadsheets and Python-powered evaluation.
Editorial review: Aug 28, 2026
Facts checked: Oct 18, 2026
Translated: Oct 18, 2026
Practical value, usability and value for money, equally weighted.
Julius is particularly useful for a chat-based data analysis workflow: gather source material, summarize it with charts from spreadsheets and turn the result into a usable asset through Python-powered analysis.
The reason to choose Julius is its specific combination of chat-based data analysis, charts from spreadsheets and Python-powered analysis. This combination sets it apart from general-purpose and specialist solutions in the 'Data Analysis & Business' category.
When data quality is poor or metrics are undefined, Julius can quickly produce attractive charts with questionable conclusions.
Ask questions about connected data in everyday language, then ask for more detail while Julius retains the previous analysis context within the conversation.
Julius: Chat with your dataPresent the same analysis as a table, chart or report, allowing you to tailor the figures and visual presentation to different audiences.
Julius: Chat with your dataConnected data sources provide the basis for recurring analyses, whose results can be regenerated and delivered at set times through Scheduled Runs.
Julius: Scheduled RunsTypical outputs with Julius: chat-based data analysis, charts from spreadsheets and Python-powered analysis; for small businesses, these can also include a short brief, a checklist and a next action for the team responsible.
Facts checked: Oct 18, 2026
Client: no · Server: no
The Julius documentation contains no MCP feature; the julius.ai/docs/mcp endpoint only searches the documentation. No source
Facts checked: Sep 30, 2026
According to the privacy policy, a DPA with Standard Contractual Clauses is available on request and is not public. Storage and processing take place only in the USA; no training on customer data; SOC 2 Type II. DPA: no · EU hosting: unclear · Headquarters: USA · Source
Facts checked: Sep 30, 2026
Free plan: yes
Permanent free plan with usage limits according to the vendor.
Facts checked: Oct 5, 2026
Analyze a CSV with marketing or sales data: ask questions, find outliers, generate charts and develop hypotheses for your next actions.
Analyze this spreadsheet through chat-based data analysis; show anomalies, possible causes, charts and three concrete management decisions.
Here is how to work with sales data: first ask for monthly revenue by product, then for the largest changes compared with the previous month. Request both a table and a chart. Julius carries over the conversation context; still check the time period, currency and definition of revenue against your original dataset.
Julius: Chat with your dataHere is how to verify a result: for an unusual channel comparison, ask to see the underlying code and an explanation of which rows were excluded. Julius provides the analysis code. Compare a small subset with your spreadsheet before including the finding in a client report.
Julius: Chat with your dataSources: Oct 18, 2026
SpellBook's finance team reports completing recurring analyses in minutes with Julius that previously took eight to ten hours.
Aman SamraJulius Customer Story · Jan 1, 2025
Julius is particularly useful for a chat-based data analysis workflow: gather source material, summarize it with charts from spreadsheets and turn the result into a usable asset through Python-powered analysis.
When data quality is poor or metrics are undefined, Julius can quickly produce attractive charts with questionable conclusions.
Data analysis through chat; charts and tables from data; data connectors and scheduled reports
Analyze a CSV with marketing or sales data: ask questions, find outliers, generate charts and develop hypotheses for your next actions.
Free plan · from 20 USD/month. See the pricing section on this page for details and the documented pricing status.