Dashboard builder
Polymer supports AI-assisted visualizations and report templates that can be delivered to users within an existing application through technical integration.
Polymer: Embedded Analytics cleverkitools.comcurated by Clever Mangos
 Editorial selection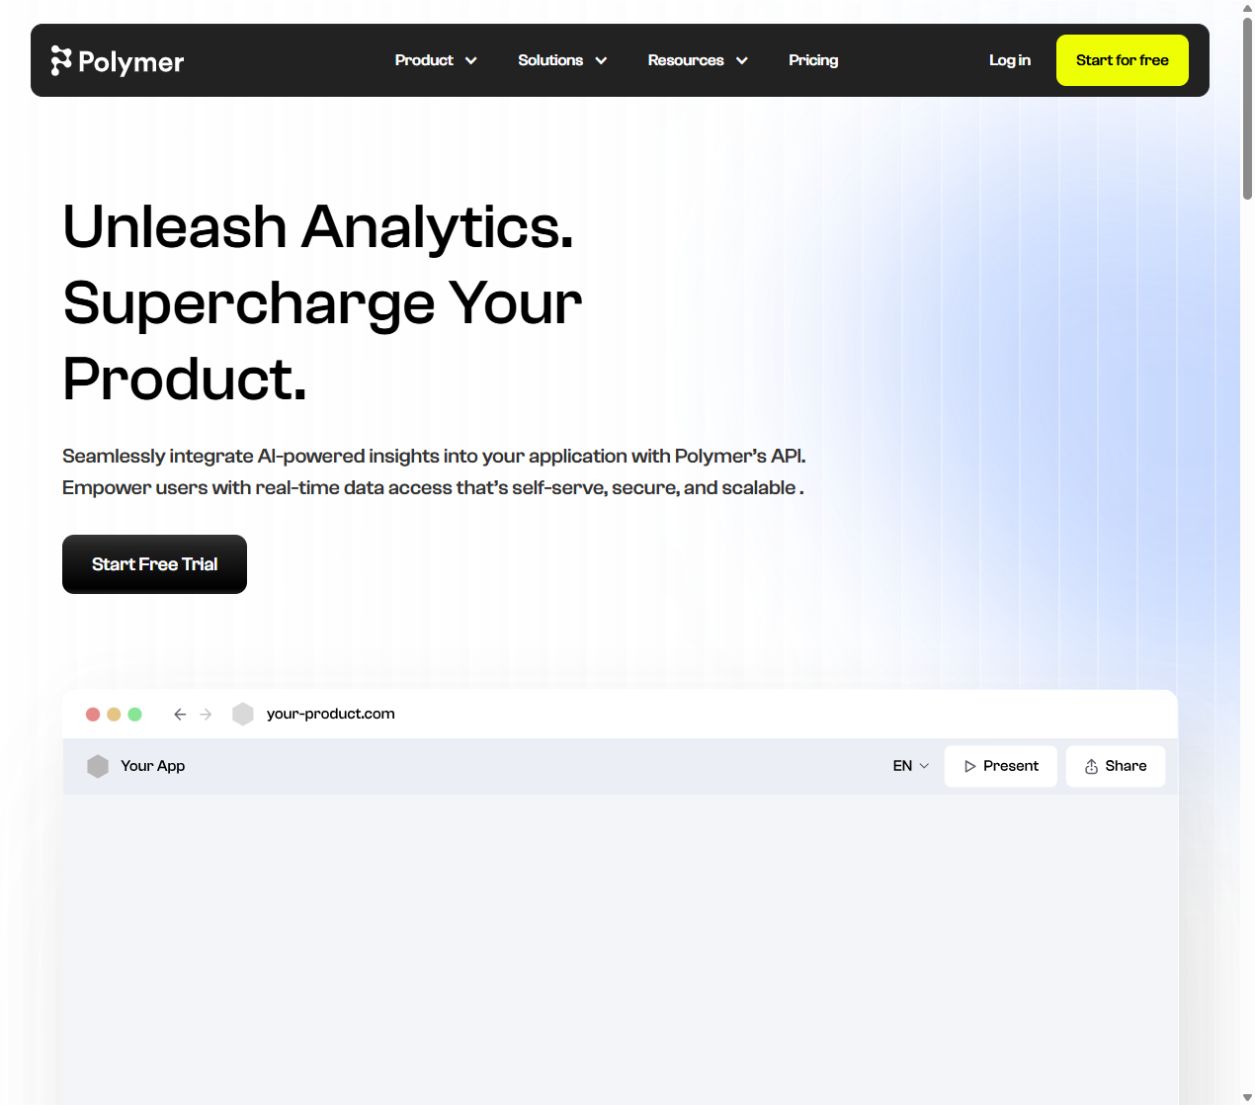
Polymer: fast dashboard creation and data exploration from spreadsheets without heavyweight BI. In practice, its value centers on a dashboard builder, data exploration and visual reports.
Editorial review: Jul 5, 2026
Facts checked: Oct 18, 2026
Translated: Oct 18, 2026
Practical value, usability and value for money, equally weighted.
Polymer is particularly suited to a workflow around dashboard building: collect source material, distill it through data exploration, and turn the result into a usable asset through visual reports.
The reason to choose Polymer is its specific combination of a dashboard builder, data exploration, and visual reports; this combination sets it apart from general-purpose or specialist solutions in the 'Data Analysis & Business' category.
When data cleaning, modeling or permissions remain unresolved, a dashboard merely conceals the problems.
Polymer supports AI-assisted visualizations and report templates that can be delivered to users within an existing application through technical integration.
Polymer: Embedded AnalyticsAn embedded analytics section lets users explore approved data themselves rather than requesting a new static report for each additional view.
Polymer: Embedded AnalyticsYou customize the font, colors, and logo of embedded reports to match your brand and provide customer metrics directly within your existing application.
Polymer: Embedded AnalyticsTypical outputs with Polymer: dashboard builder, data exploration, visual reports; for small businesses, also a short briefing, a checklist and a next action for the responsible team.
Facts checked: Oct 18, 2026
Client: no · Server: no
No official MCP server found. No source
Facts checked: Sep 30, 2026
No DPA or transfer basis in the privacy policy, no information found. DPA: no · EU hosting: unknown · Company headquarters: USA · Source
Facts checked: Sep 30, 2026
Free plan: no
The current provider page lists Starter at 20 USD with monthly payment; the 50 USD in the CSV is outdated.
A time-limited trial is available; it does not count as a free plan.
Facts checked: Oct 5, 2026
Create a dashboard from a CSV or Google Sheet: connect data, set filters, build visuals and share a management view.
Analyze this table for dashboard building; show unusual findings, possible causes, charts and three specific management decisions.
Use the current focus by embedding a sample report with the five main customer metrics in your existing portal and adapting it to your colors and fonts. Polymer describes API-based embedded analytics for this. Plan for the technical integration and first check a complete test customer case.
Polymer: Embedded analyticsHere is how to prepare client reports: define which datasets each client may see and set up permissions through the intended API. Check results with two separate test accounts. Polymer explicitly mentions user-based access control; a visually separate view alone is insufficient verification.
Polymer: Embedded analyticsSources: Oct 18, 2026
Polymer is particularly suited to a workflow around dashboard building: collect source material, distill it through data exploration, and turn the result into a usable asset through visual reports.
When data cleaning, modeling or permissions remain unresolved, a dashboard merely conceals the problems.
Dashboard builder; data exploration; visual reports
Create a dashboard from a CSV or Google Sheet: connect data, set filters, build visuals and share a management view.
Paid · from 20 USD/month. Pricing details and the documented status are in this page's pricing section.